In response to changes in 2016 to how the state collects and reports 4-year cohort graduation and other outcome data, Ed-Data has created three new sets of graphs to present richer experiences when you view graduation, dropout or UC/CSU eligibility data. These graphs are available at the school, district, county and state level in the College and Career Readiness section of the Student tab.
The graphs provide data by race/ethnicity, gender, students with disabilities as well as for English learners, foster youth, homeless, migrant, and socioeconomically disadvantaged students. At the state, county and district level, these you can now view data for all students or toggle between students enrolled in traditional district schools or in charter schools. With 2019-20 data, we have added a new graph that provides the total number of students in the adjusted cohort. You can use the menus above the graph to drill in for counts by race/ethnicity and other information, such as students with disabilities, homeless, migrant and foster youth, and socioeconomically disadvantaged students.
We have also added additional data elements to the school and district comparisons so you can compare graduation and dropout rates for some of the newly added student groups.
About the Adjusted Cohort Graduation Rate Data
These new data are known as the four-year adjusted cohort graduation rate, or ACGR. It is the number of students who graduate from high school in four years with a regular high school diploma divided by the number of students who form the adjusted cohort for the graduating class. The four-year cohort is based on the number of students who enter grade 9 for the first time adjusted by adding into the cohort any student who transfers in later during grade 9 or during the next three years and subtracting any student from the cohort who transfers out, emigrates to another country, transfers to a prison or juvenile facility, or dies during that same period.
As part of this change, CDE now provides UC/CSU eligibility data (also known as A-G course data) as part of the 4-year cohort data.
For the ACGR, a “regular high school diploma” is the standard high school diploma awarded to the preponderance of students in a State that is fully aligned with the State’s standards and does not include a general equivalency diploma, certificate of completion, certificate of attendance, or any other similar or lesser credential, such as a diploma based on meeting Individualized Education Program (IEP) goals. Additionally, for the ACGR, a high school is a secondary school that grants a regular high school diploma and includes, at least, grade twelve (Elementary and Secondary Education Act (ESEA) section 8101(28)).
Please note: Because of the changes to how students are included in the cohort, it is not possible to compare the new cohort graduation and dropout data, which started in 2016-17, with data from prior years. To avoid confusion, graduation data for prior years can be found on Ed-Data in in the Performance section.
Where to find the data
The data are available in the College and Career Readiness section of the Student Profile:
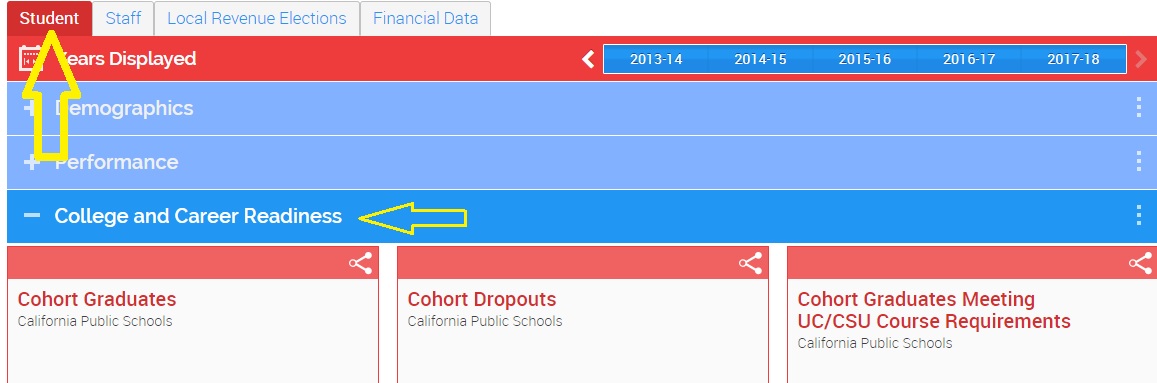
You can use the drop-down menu immediately above the graphs to drill in for more detail, such as gender and race/ethnicity.
Using the data in comparisons
These data are also available in the school and district comparisons on Ed-Data. For the cohort graduation and dropout data, you can now also filter the data by race/ethnicity in comparisons. Here's how:
1. Go to school or district comparisons.
2. Click the three dots (...) in the College and Career Readiness section in the left column to view available performance data elements. Click on an element to add it to your comparison.

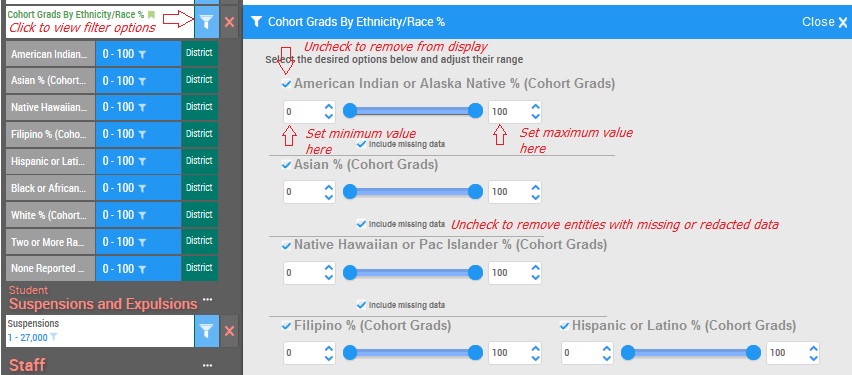
3. Once you have added graduates and/or dropouts by ethnicity, you can use the filters to select the ethnic subgroups displayed and even set minimum and maximum values for each subgroup:
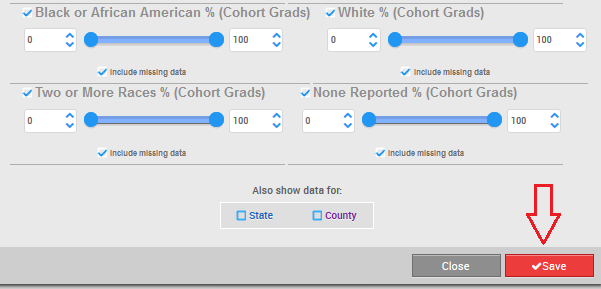
4. Click "Save"
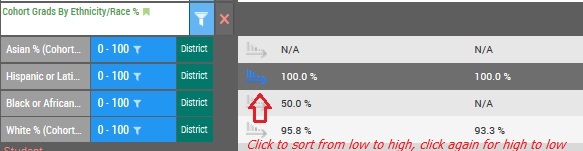
5. Once you have added the desired subgroups and saved, you can sort the data in your comparison:
To learn more, please see How to Create District or School Comparisons. If you have questions about the comparisons, please contact us.
Elimination of High School Exit Exam requirement
From 2006-2014, almost all California high school students were required to pass the California High School Exit Exam (CAHSEE) to graduate from high school. However, lawmakers eliminated that requirement in 2016 and ordered districts to retroactively grant diplomas to students who met all other graduation requirements but did not pass the exam. This change may affect graduation and dropout rates from 2015-16 onward, however data already published will not be changed to reflect diplomas granted retroactively.